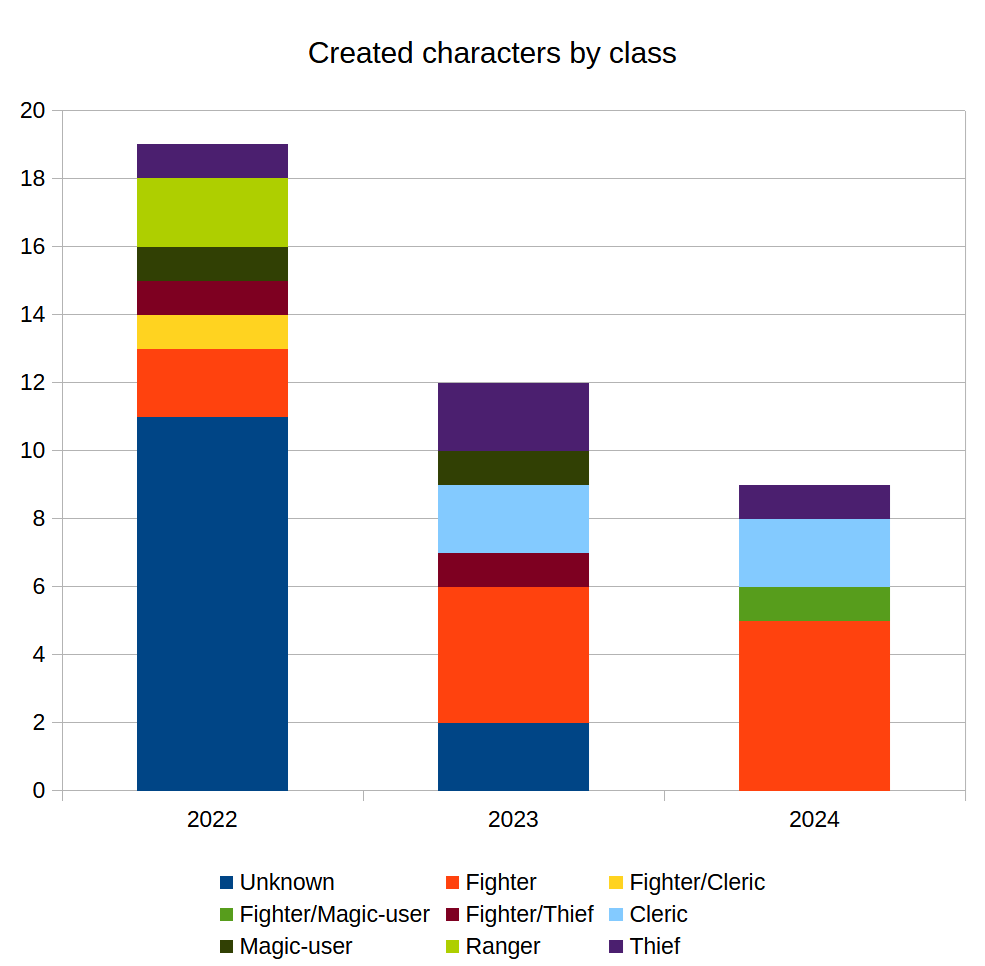
I’ve collected some statistics from the last three years, about our Open D&D Table game, whose threads you occasionally see pop up. Most things should be self explanatory, so I won’t explain much.
I suppose I should be drawing meaningful lessons from this, but all I can see is that we should hang at the park more often.
But when your game inspires pie charts, the only thing you can really do is offer a heartfelt thank you. So, thank you. And I hope that one days you’ll share all the other data I’m certain you’re tracking. Are monsters more dangerous on Südstadt days? Are xp gained higher when Nigel smells treasure? Inquiring minds want to know!